Analytics & Usage Statistics
Monitor expert usage, question volume, and storage stats.
The analytics page gives you a comprehensive overview of how your workspace is being used. At a glance, you can see how many experts are active, how many questions have been asked, and how your storage is doing.
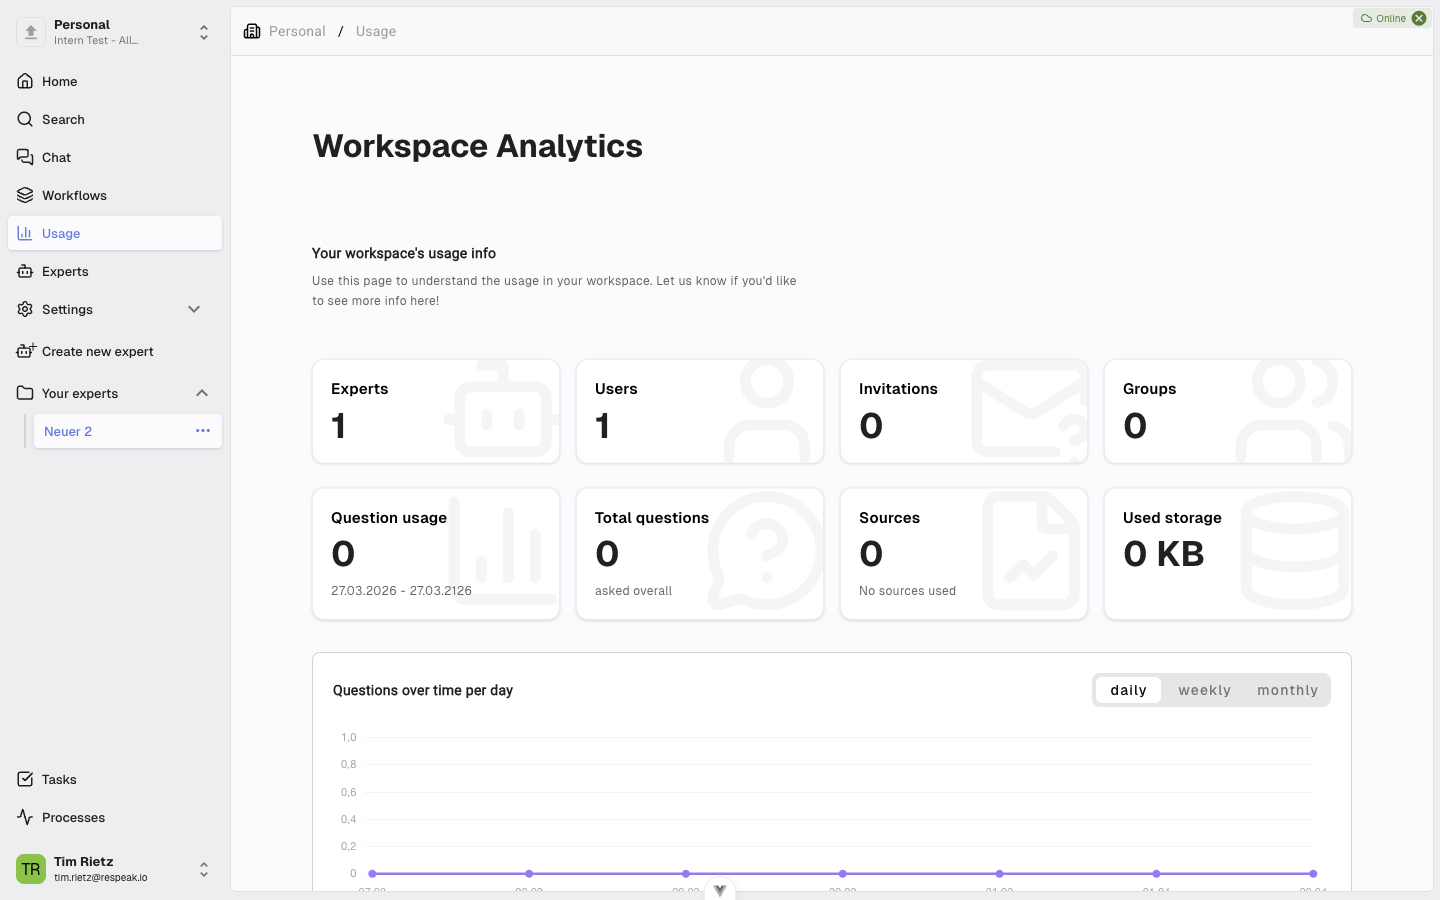
Open Analytics
Open Settings
Open your workspace and click Settings in the sidebar.
Select Usage
Select the Usage section.
Key Metrics
At the top of the page you will see cards with the most important metrics: the number of Experts in your workspace (with the subscription limit, if applicable), the number of Users with access, pending Invitations, and the number of Groups.
Below that, you will find additional cards with usage data: Question usage in the current billing period (including a comparison to the previous month), the total number of questions asked since the workspace was created, the number of Sources (documents and websites), and the used storage (with the limit and percentage, if applicable).
Charts
Below the key metrics you will find several charts that help you spot usage trends:
Chart | Description |
|---|---|
Questions over time | A line chart showing how the number of questions has developed over time. |
Ratings | A pie chart showing the distribution of answer ratings (helpful, not helpful, not rated). |
Negative rating reasons | A bar chart breaking down why answers were rated as unhelpful (e.g. "factually incorrect", "too short", "inaccurate", or "other"). |
Dashboard (Home)
On your workspace home page you will also find an overview of your experts, showing each expert's name and description, the number of questions asked, and the number of knowledge sources added.
You can switch between a card view and a list view. Use the search field to filter the list. Clicking an expert takes you directly to its detail page.
Processes
The dashboard also shows an overview of your processing tasks. You can see both running processes (tasks currently being worked on, e.g. document processing) and completed processes (recently finished tasks). The time range is adjustable via the process history filter (Last 3 Days, Last 7 Days, or Last 30 Days).
Subscription
If your workspace has a subscription, the dashboard also displays information about your current plan: the subscription period and next payment, the workspace limits (how many experts, users, questions, storage, and other resources your plan includes), and the current usage for each limit.
This helps you keep track of whether your workspace stays within the agreed limits.